The role of Kibana in data visualisation: from data to insight
Data is everywhere. Log files, user statistics, IoT signals, financial figures – organisations are collecting more information than ever before. But what use is all that data if you don’t have an overview? Without the right tools, data often remains abstract and elusive.
This is where Kibana comes in. Kibana, part of the Elastic Stack, helps organisations make complex data understandable and actionable through powerful visualisations and dashboards.
Kibana is a visualisation tool for Elasticsearch.
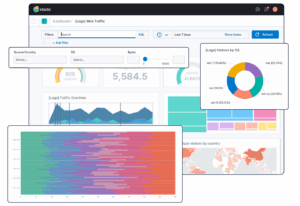
Kibana is the visualisation tool of the Elastic Stack (Elasticsearch, Logstash, Kibana and Beats). Where Elasticsearch stores and makes data searchable, Kibana is the layer with which you translate that data into graphs, maps, tables and interactive dashboards.
The beauty of Kibana is that it supports both technical and non-technical personnel: from data engineers analysing log files to business analysts wanting to track customer behaviour.
Why Kibana for data visualisation?
- Real-time insight
Dashboards work directly with the most up-to-date data. Whether it's system failures, security incidents, or sales figures, Kibana provides immediate insight. - Flexible
Choose from diverse visualisations: from line charts and heatmaps to geographic maps and treemaps. - User-friendly
You don't need to write code to build dashboards. With just a few clicks, you can put together visual reports. - Integration with observability and security:
Kibana seamlessly integrates with Elastic Security and Observability, bringing together logs, metrics, and traces into a single environment.
Examples of applications
Kibana is used in a wide variety of environments, from technical monitoring to business intelligence. In the IT and operations world, for example, it is an indispensable tool for keeping an eye on servers, applications, and cloud environments. Thanks to real-time dashboards, teams can see immediately if there are peak loads or outages, and can intervene quickly.
Kibana also proves its value in the area of security. In combination with Elastic Security, it functions as a fully-fledged SIEM dashboard: threats become visible in real-time, suspicious patterns can be investigated immediately, and incidents are resolved faster.
However, the applications extend beyond IT and security. Increasingly, organisations are using Kibana for business analytics. Consider insights into customer behaviour, monitoring product performance, or generating financial reports. The power of Kibana is that all these insights come together in one environment, allowing both technical teams and business departments to work with the same data.
Tips for effective dashboards
The success of a Kibana dashboard hinges on how you set it up. A common mistake is to start too big, stuffing all available data into one dashboard immediately. The result is often an overcrowded screen where the most important insights get lost. Therefore, start small: focus first on a few core KPIs that are truly relevant to your organisation.
The design also plays a significant role. Graphs, maps, and tables each have their own strengths. By using visual variety, you make patterns more quickly apparent and prevent users from having to scroll through long lists of numbers. At the same time, simplicity is important. Keep dashboards organised and avoid the temptation to display everything you can measure.
Finally, it pays to combine dashboards with alerts. This ensures that deviations or potential problems are automatically brought to your attention, without you having to constantly monitor the dashboards yourself. In this way, dashboards become not only a source of insight, but also an active tool in your daily operations.
The role of PuurData
At PuurData, we help organisations get the most out of Kibana. We provide support with:
- setting up and configuring dashboards,
- choosing the right visualisations,
- integrating Kibana with Elastic Security and Observability,
- and training teams to work effectively with Kibana themselves.
The result: dashboards that are not only attractive but also genuinely contribute to better decisions.
Finally
Kibana gives organisations control over data by transforming abstract figures into visual insight. It is flexible, user-friendly, and powerful when combined with Elasticsearch.
Would you like to discover how your organisation can get more value from data with Kibana? Read more about our Elastic expertise or plan a demo with one of our consultants.
Want to know more?
Would you like to know more or do you have questions about the possibilities? Call us on +31 (0)88-7887328, visit our Contact page, fill in the form below!
Recent news reports